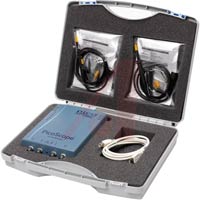
PP671產(chǎn)品概述
High Resolution and Accuracy: With 12-bit resolution and 1% accuracy, the PicoScope 4000 Series are able to detect changes as small as 0.024% (244 ppm) — Making it the ideal oscilloscope for testing audio circuits, and for measuring noise and vibrations.
Capture Large and Complex Signals: The 32,000,000 (512,000 on the PicoScope 3425) sample buffer (record length) enables large amounts of data to be captured at high sampling rates. This allows the capture of fast-changing signals over relatively long periods of time, while the fast USB 2.0 interface ensures a quick screen update rate. After capturing these signals, any areas of interest can be magnified up to 3.2 million times to allow you to examine every last detail of the signal. If the 32 M sample record length isn’t enough the PicoScope software can record up to 10000 captures in its circular waveform buffer enabling scrolling through data, which is especially useful when analyzing or monitoring irregular and intermittent events.
Wide Voltage Inputs: Do you need to measure floating or non-ground referenced signals? Do you need to measure signals in the presence of 50 Hz or 60 Hz common-mode noise? With the PicoScope 3425 differential oscilloscope you can do so without the need for expensive differential preamplifiers or probes. With up to ±400 V the PicoScope 3425 covers a wide range of applications.
Built in Arbitrary Waveform Generator: The new PicoScope 4226 and 4227 scopes have a built-in 20 MSPS AWG and external trigger both with dedicated BNC connections on the front panel. A free software utility included with PicoScope 6 allows the user to import, export, modify and draw waveforms in the waveform editor, which can then be output from the BNC.
PicoScope Oscilloscope and Data Acquisition Software: The PicoScopes are supplied with PicoScope software that provides oscilloscope, spectrum analyzer and meter functions. PicoScope software makes full use of your PC's processing capabilities allowing you to view real-time signals, zoom in on your signal, and save and print captured waveforms. The familiar Windows graphical interface of the PicoScope software provides many intuitive tools to display and analyze captured data. The display area is kept uncluttered to maximize the data view. Commonly used controls such as voltage range selection, timebase, memory depth, trigger functions and channel selection are found on the front panel for quick access. New features are continuously being added and available through software downloads for free. More advanced functions are found within the options menu and include serial decoding, mask testing, advanced triggers and waveform math. For custom applications drivers and examples are supplied for third party software free of charge.


 Datasheet


